Climate Safe KCK
Participants of Climate Safe KCK community workshop come together to brainstorm climate adaptation in Kansas City, KS.
KCK Residents Respond to Climate Change
Climate Safe KCK brings residents of frontline communities together to share experiences, challenges, and solutions to the health and economic effects of climate change. Groundwork NRG staff convenes workshops with residents and stakeholders to explore the relationship between the city's history of housing segregation and the current and predicted impacts of the climate crisis. This format offers an opportunity to work with neighbors on interventions that make our neighborhoods safer in an uncertain future.
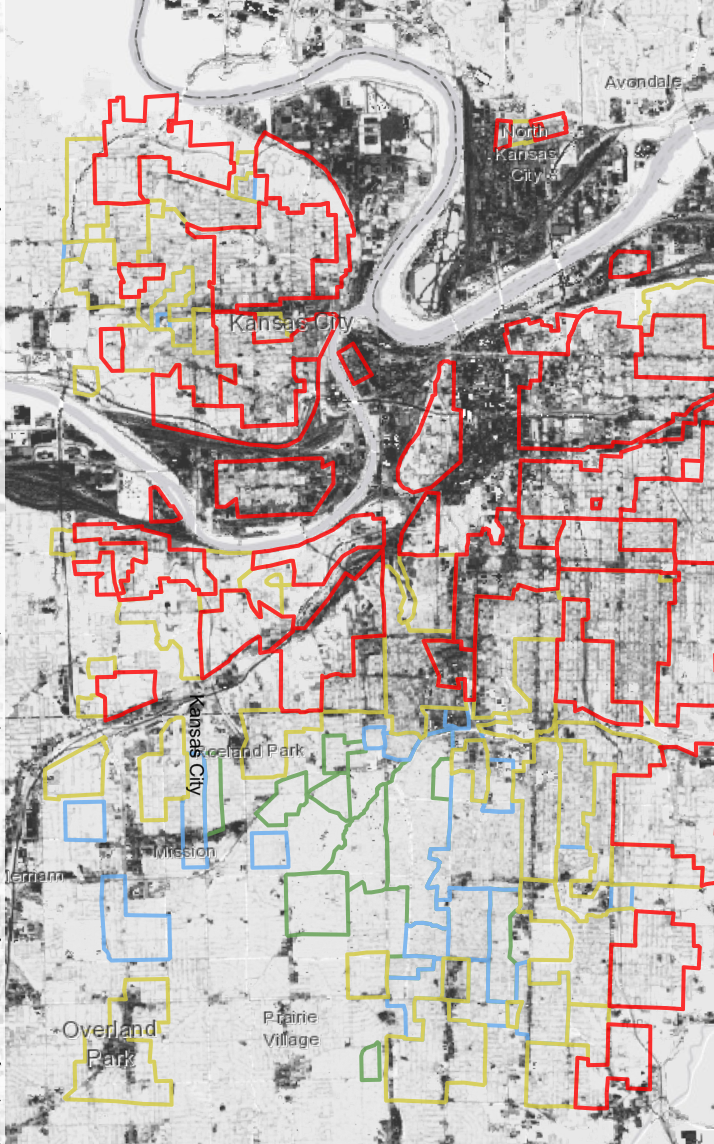
Historical redlining maps and modern satellite imagery reveal a relationship between federal race-based housing segregation and vulnerability to extreme heat and flooding in Kansas City today. Our Climate Safe KCK group uses this data to build our capacity to self-advocate for climate adaptation measures.
Join a Climate Safe KCK Workshop
Want to join an upcoming Climate Safe KCK workshop? We're looking for individuals who are motivated to participate and learn, have household income less than $35,000/year, and are current residents of Wyandotte County. Spots are limited. Must attend all four sessions.
Contact admin@northeastkck.org to get involved.
Historic Redlining Affects Climate Impacts
The historic discriminatory practice of redlining resulted in disinvestment from areas in red across the Kansas City area.
Today, this disinvestment means that the affects of climate change like high temperatures and flooding impact Northeast KCK more than other areas in the Metro.
Read The Heat Report to learn about the history of redlining in Kansas City, KS and its affects on health outcomes in our neighborhoods today.
Historic Redlining
Redlining Map Overlaid on KC Metro
More Impervious Surfaces
Redlining Map Overlaid on Impervious Surfaces Map
Less Tree Canopy
Redlining Map Overlaid on Tree Canopy Cover Map
Greater Urban Heat Island Effect
Redlining Map Overlaid on KC Metro Median Surface Temperature, illustrating Urban Heat Island Effect
Climate Safe KCK Dashboard
A core strategy of Climate Safe KCK is to support our outreach and organizing efforts with data. By pointing to actually existing disparities in exposure to environmental hazards like heat and flooding and placing those disparities in the context of historical practices of segregation, we are able to more clearly define and advocate for our vision of a Climate Safe KCK. This map dashboard contains many map layers that have helped us define our vision and make our argument for change.


